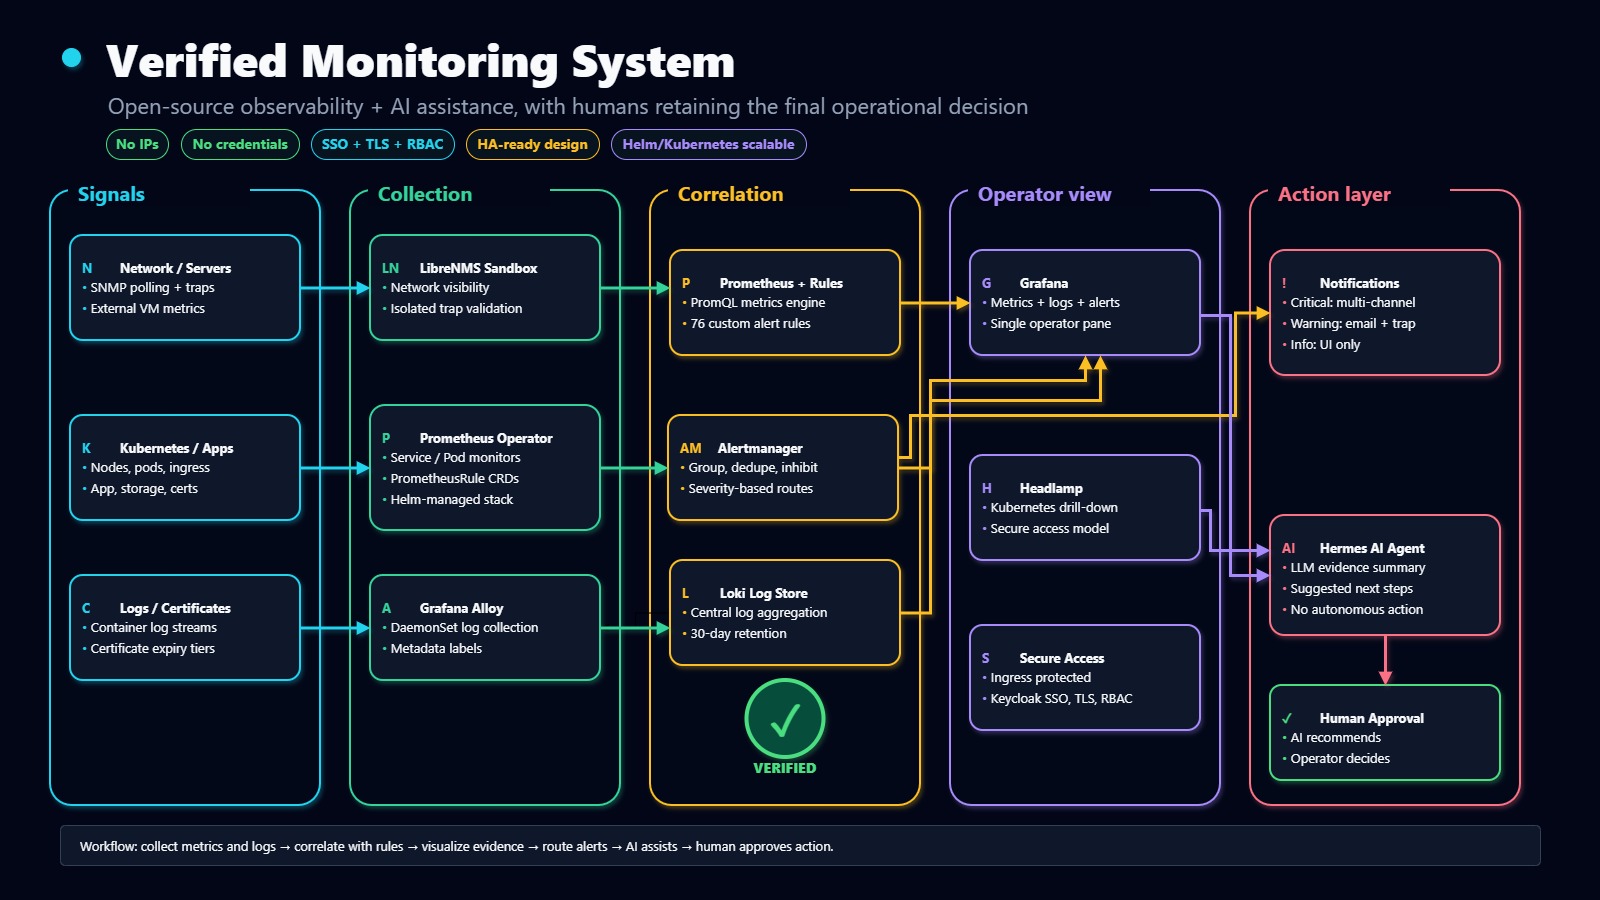
I have been working on a verified #monitoring and #observability system in my #homelab.
The goal was to build a stack that can detect alarms, warnings, outages, certificate issues, Kubernetes problems, application failures, log patterns, and infrastructure health problems, while keeping the final operational decision with a human.
#AI and #AI #agents can help a lot in network and #infrastructure operations. They are useful for summarizing alerts, correlating evidence, and suggesting next steps. However, I do not believe AI should make end-to-end operational decisions on its own, especially in enterprise, operator, or critical environments.
So I verified a practical middle ground:
AI assists.
The monitoring stack verifies.
The operator decides.
The bundle includes:
- LibreNMS in sandbox mode for traditional network and #SNMP monitoring
- Prometheus for Kubernetes (Official), VM, exporter, and application metrics
- Grafana Labs as the main operator view
- #Alertmanager for grouping, deduplication, inhibition, and routing
- #Loki and #Grafana Alloy for centralized log collection
- Headlamp for Kubernetes (Official) visibility
- Custom alarm and notification routing
- #Hermes (Nous Research) as the AI agent layer
In the #Kubernetes environment, kube-prometheus-stack collects metrics from nodes, pods, services, exporters, and external Linux VMs. #Grafana brings #Prometheus, #Loki, and #Alertmanager into one place, so an operator can move from metrics to logs to alert state without jumping between tools.
The alerting flow is designed to reduce noise. Alerts are grouped before notification, duplicated symptoms are suppressed, and severity controls the notification channel. Critical alerts can go to multiple channels, warnings use lower-noise paths, and info alerts stay visible in Grafana or #Alertmanager without external notifications.
I also verified tiered #certificate monitoring, which is important when using short-lived certificates and automated renewal.
On the AI side, Hermes works with multiple #LLM backends, including GLM, OpenAI, and Mistral-class models. The #AI layer does not blindly execute changes. It summarizes context, explains possible causes, and suggests what the operator should check next.
For security, dashboards are protected through ingress, #SSO, #TLS, and #RBAC concepts instead of being exposed as unauthenticated tools.
The main lesson from this verification:
If you are interested in this architecture or want to see the workflow in practice, feel free to ping me. I would be happy to give a free demo.
#Monitoring #Observability #Prometheus #Grafana #Alertmanager #Loki #LibreNMS #Kubernetes #DevOps #NetOps #AIOps #AI #Infrastructure #Homelab